Data Science Analyst
Thermo Fisher Scientific · 05/2024 – Present
ML Forecast
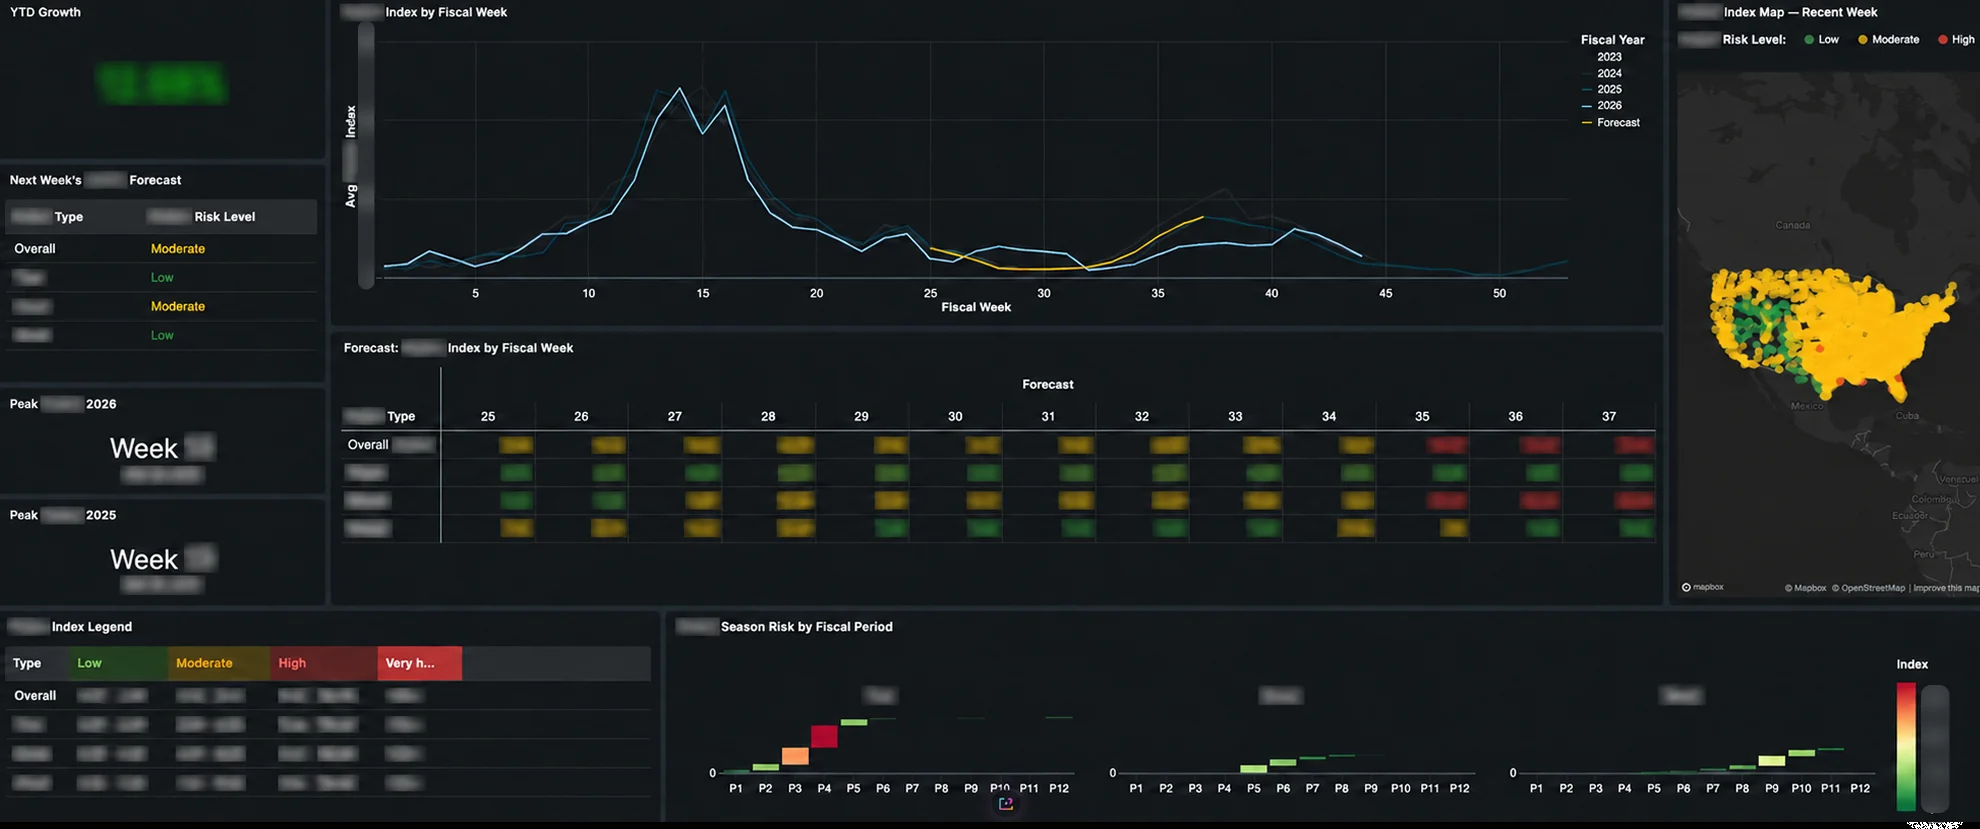
- What it is
- A rolling 13-week forecast covering multiple financial and product-utilization metrics, broken down by type and refreshed every week.
- How I built it
- Brought environmental factors in alongside historical trends, combining machine learning with classical econometrics. The forecast holds 90%+ accuracy.
- What the dashboard shows
- Compares this year against past years by fiscal week, flags each type’s risk level (low → very high) for the weeks ahead, maps the most recent week’s risk across the US, and tracks YTD growth and risk by fiscal period.
- Impact
- Drives weekly planning and budget conversations.
Market Opportunity
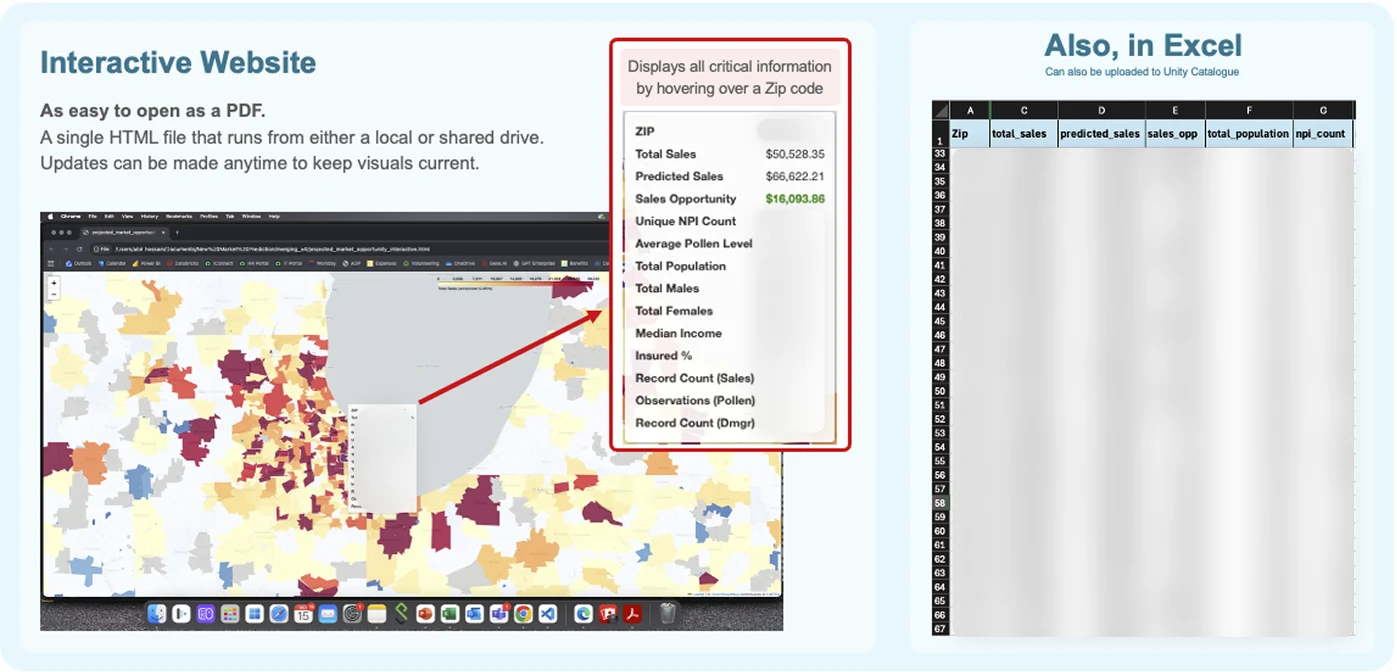
- The data
- Gathered sales, demographic (population, income, insured %) and environmental (pollen) data and structured it monthly at the ZIP-code level.
- How I built it
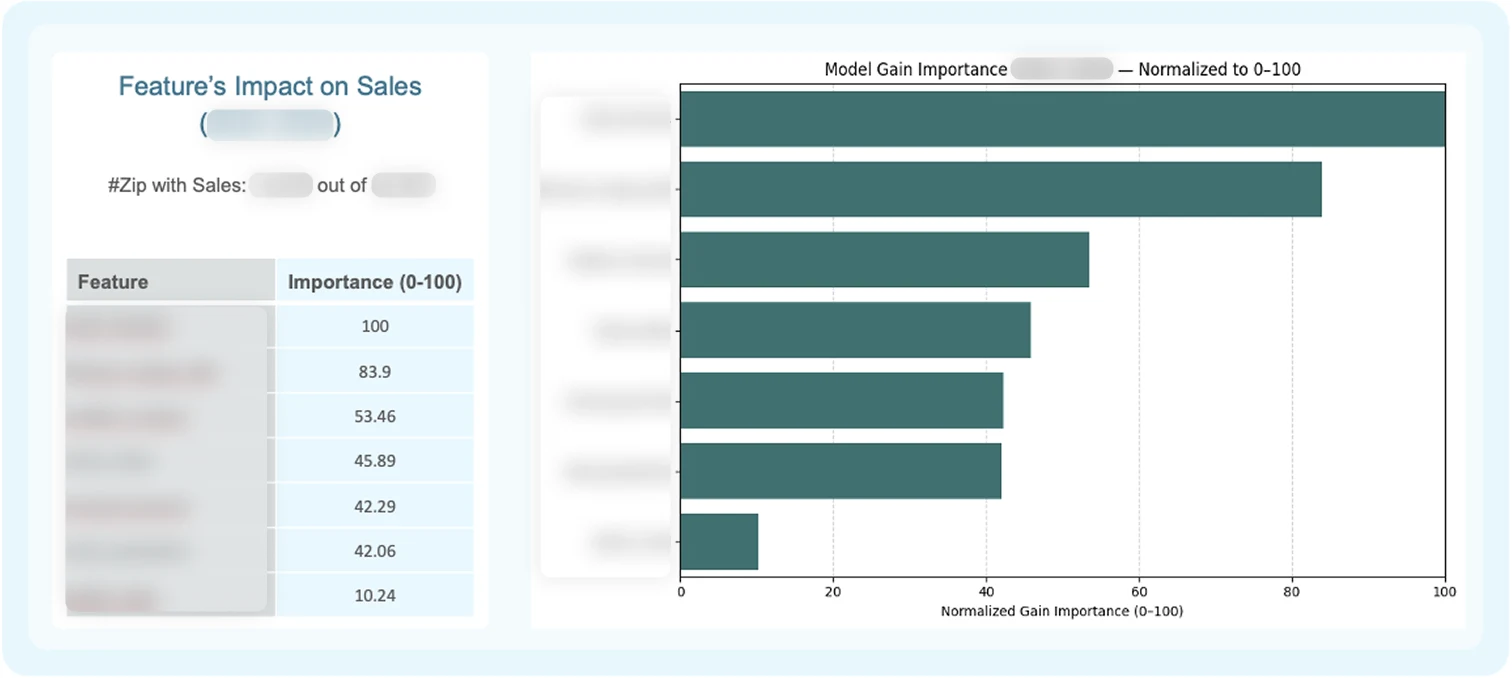
- Built and compared prediction models: gradient-boosted trees, an ensemble and a winsorized statistical model. Prescriber (NPI) density and population turned out to be the two strongest indicators of sales.
- What it predicts
- Scaled from regional to nationwide projections. It predicts sales for ZIPs with no prior sales and flags underperforming ones, so predicted minus actual becomes the sales opportunity.
- What leadership gets
- An interactive map in a single HTML file: hover over any ZIP to see sales, predicted sales, opportunity, NPI count, pollen, population, income and more. Plus an Excel export that can be uploaded to Unity Catalog.
Research on Top Factors Impacting Sales
- The scope
- Looked at every US ZIP code with sales and compared it against every available environmental and demographic factor.
- How I measured it
- Used feature-engineered econometric and tree-based models to measure how much each factor moves sales, ranked on a 0–100 importance scale.
- What it found
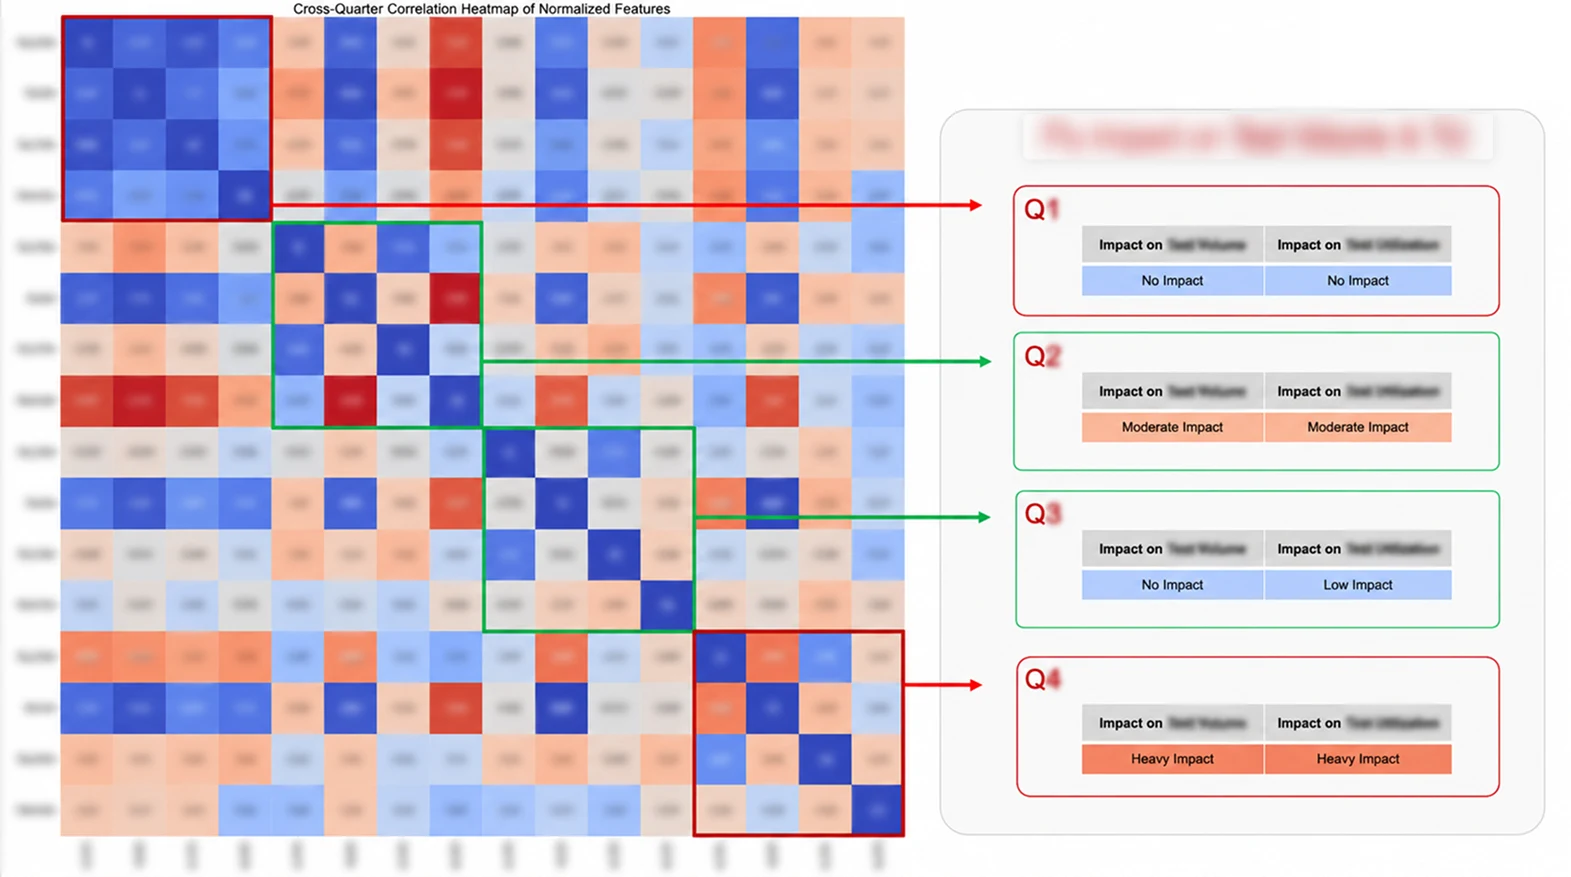
- Cross-quarter correlation showed the effect is seasonal: little to none in Q1 and Q3, moderate in Q2 and heavy in Q4, on both volume and utilization.
- Impact
- Turned the strongest drivers into strengths for the go-to-market strategy.
Leading with AI
- My role
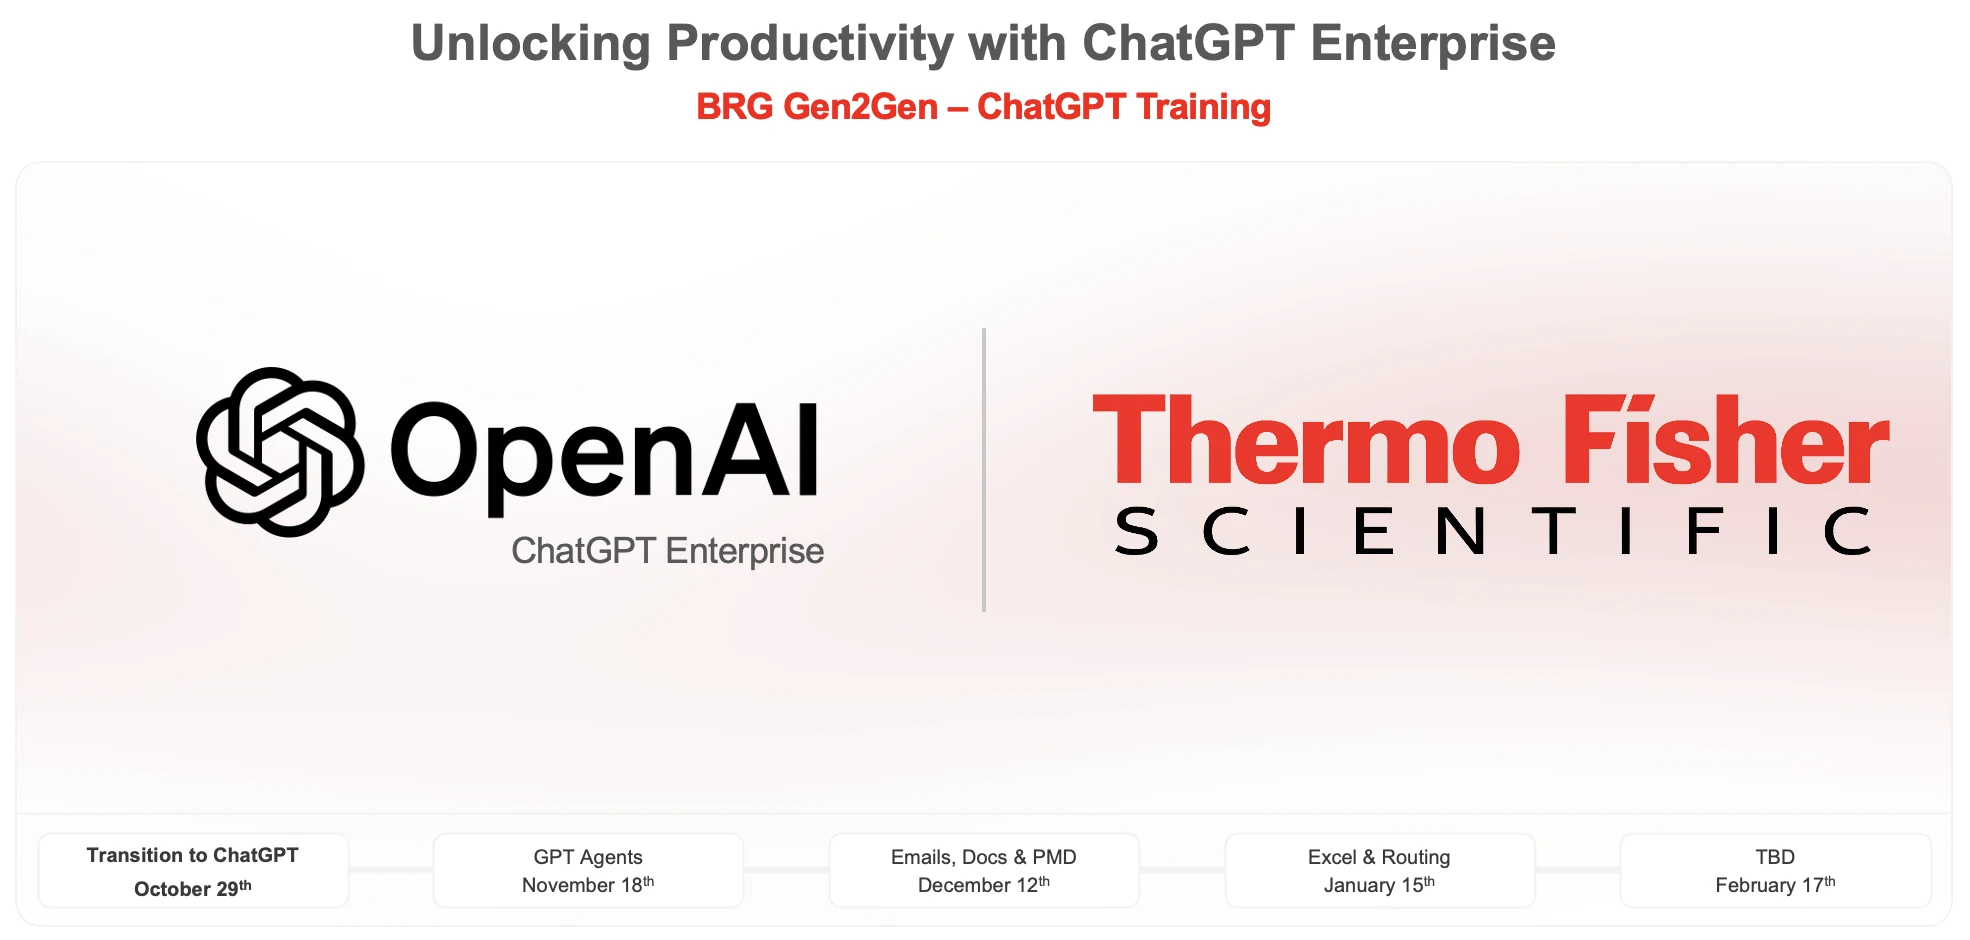
- As IDD’s Gen AI Ambassador, I partner with digital literacy managers to train global teams on Gen-AI tools.
- The training series
- Lead “Unlocking Productivity with ChatGPT Enterprise” with the Gen2Gen BRG: the transition to ChatGPT, GPT agents, emails, docs & PMD, and Excel & routing.
- What I build
- Internal GPT agents used by multiple teams.
- Impact
- The agents save 10–12 hours a week across those teams.